Median Condo Prices
The National Association of Realtors (NAR) is set to release its most recent Existing Home Sales (EHS) report tomorrow. This monthly release provides information on the volume of sales and price trends for homes that have previously been owned. In the upcoming release, it’ll likely say home prices are down. This may seem a bit confusing, especially if you’ve been following along and reading the blogs saying home prices have hit the bottom and have since rebounded.
So, why would this say home prices are falling when so many other price reports say they’re going back up? It all depends on the methodology of each one. NAR reports on the median home sales price, while some other sources use repeat sales prices. Here’s how those approaches differ.
The Center for Real Estate Studies at Wichita State University explains median sales prices like this:
“The median sale price measures the ‘middle’ price of homes that sold, meaning that half of the homes sold for a higher price and half sold for less . . . For example, if more lower-priced homes have sold recently, the median sale price would decline (because the “middle” home is now a lower-priced home), even if the value of each individual home is rising.”
Investopedia helps define what a repeat sales approach means:
“Repeat-sales methods calculate changes in home prices based on sales of the same property, thereby avoiding the problem of trying to account for price differences in homes with varying characteristics.”
The Challenge with the Median Home Sales Price Today
As the quotes above say, the approaches can tell different stories. That’s why median home sales price data (like EHS) may say prices are down, even though the vast majority of the repeat sales reports show prices are appreciating again.
Bill McBride, Author of the Calculated Risk blog, sums the difference up like this:
“Median prices are distorted by the mix and repeat sales indexes like Case-Shiller and FHFA are probably better for measuring prices.”
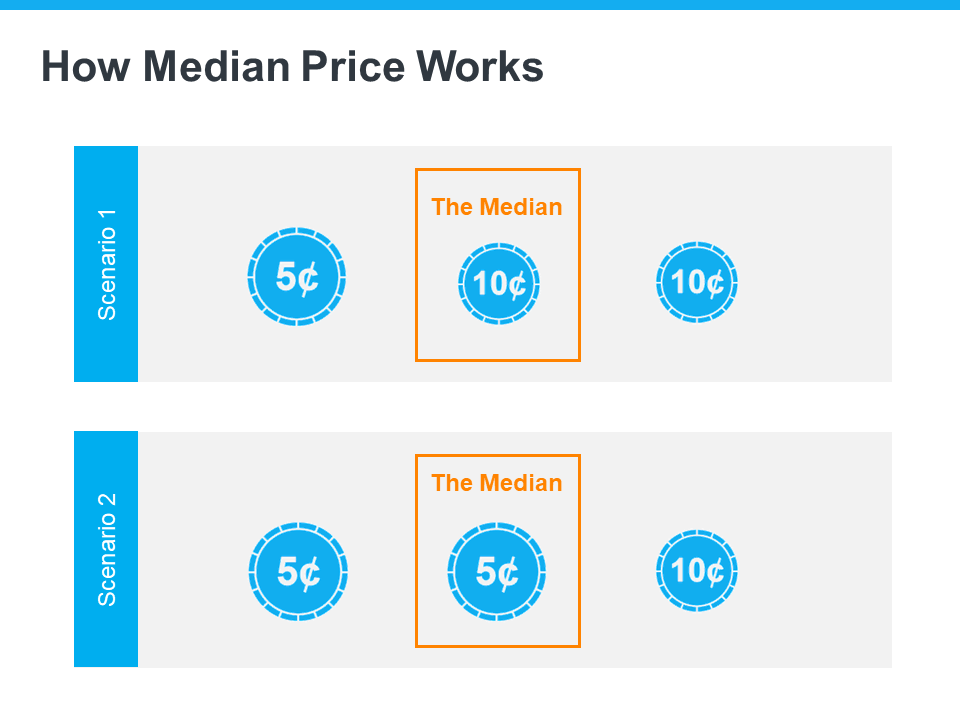
To drive this point home, here’s a simple explanation of median value (see visual below). Let’s say you have three coins in your pocket, and you decide to line them up according to their value from low to high. If you have one nickel and two dimes, the median value (the middle one) is 10 cents. If you have two nickels and one dime, the median value is now five cents.
 In both cases, a nickel is still worth five cents and a dime is still worth 10 cents. The value of each coin didn’t change.
That’s why using the median home sales price as a gauge of what’s happening with home values may be confusing right now. Most buyers look at home prices as a starting point to determine if they match their budgets. But most people buy homes based on the monthly mortgage payment they can afford, not just the price of the house. When mortgage rates are higher, you may have to buy a less expensive home to keep your monthly housing expense affordable.
That’s why a greater number of ‘less-expensive’ houses are selling right now – and that’s causing the median home sales price to decline. But that doesn’t mean any single house lost value.
When you see the stories in the media that prices are falling later this week, remember the coins. Just because the median home sales price changes, it doesn’t mean home prices are falling. What it means is the mix of homes being sold is being impacted by affordability and current mortgage rates.
Bottom Line
For a more in-depth understanding of home price trends and reports, let’s connect.
_________________________________________________________________________________________________________________________________________________________________________
Cities: Allston, Back Bay, Beacon Hill, Brighton, Brookline, Cambridge, Charlestown, Chinatown, Dorchester, East Boston, Fenway, Financial District, Hyde Park, Jamaica Plain, Leather, Mattapan, Midtown, North End, Roslindale, Roxbury, Seaport, South Boston, South End, Theatre District, Waterfront, West End, West Roxbury
2003 – 2004 – $360,000.00
2004 – 2005 – $411,675.00
2005 – 2006 – $465,000.00
2006 – 2007 – $483,750.00
2007 – 2008 – $482,500.00
2008 – 2009 – $485,000.00
Note: I used the month of March as the month of reference.
(i.e. 3/1/03-2/28/04) condos only.
Source: LINK